Kirjeldus
MAXQDA Analytics Pro
Statistical analysis meets qualitative research.
MAXQDA Analytics Pro adds the Stats module to the advanced qualitative analysis features of MAXQDA. Seamlessly quantify your qualitative data and enrich your analysis with evidence and plausibility. Statistically analyze your qualitative data in MAXQDA or import and connect your data with data sets in the Excel or SPSS format.
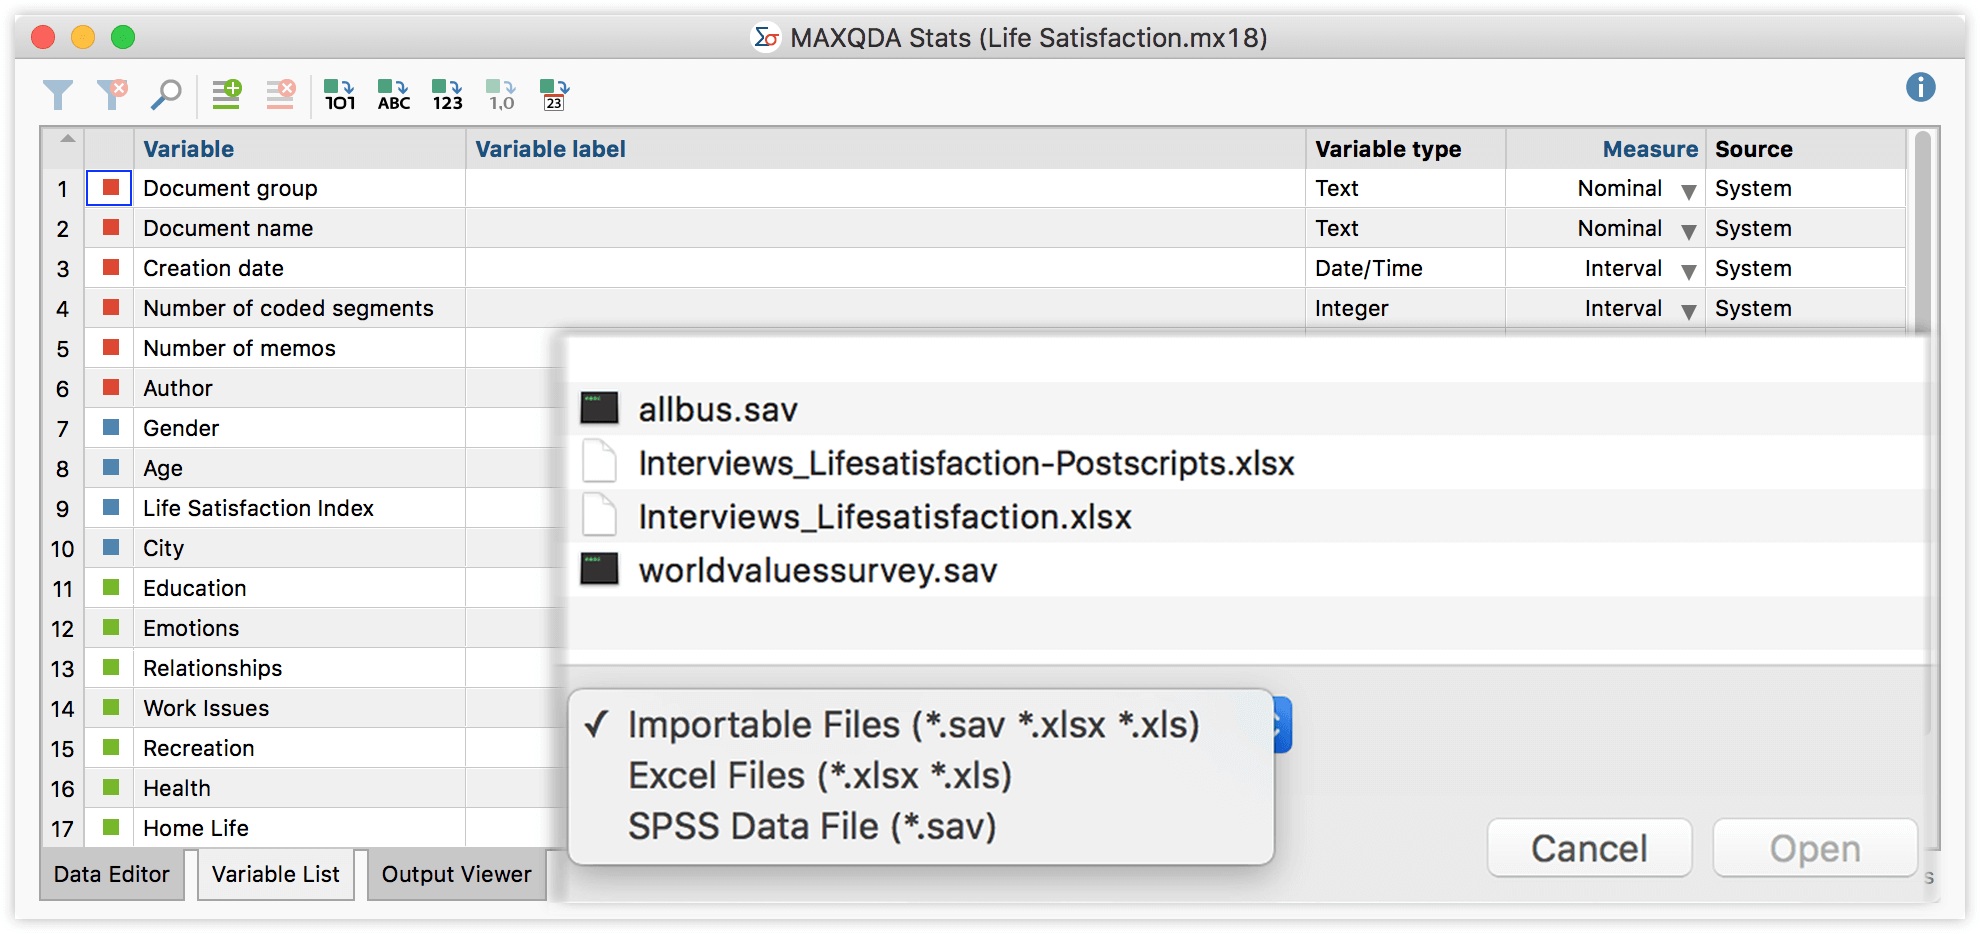
Data Compatibility
Use the Stats module to run statistical calculations with your MAXQDA project data. Statistically analyze code frequencies across documents and create new data groups in your qualitative project based on statistical results. Include all parts for your data or use activation to limit the analysis to specific documents and codes. You can also work with Excel or SPSS datasets – just like in any other statistical software package.
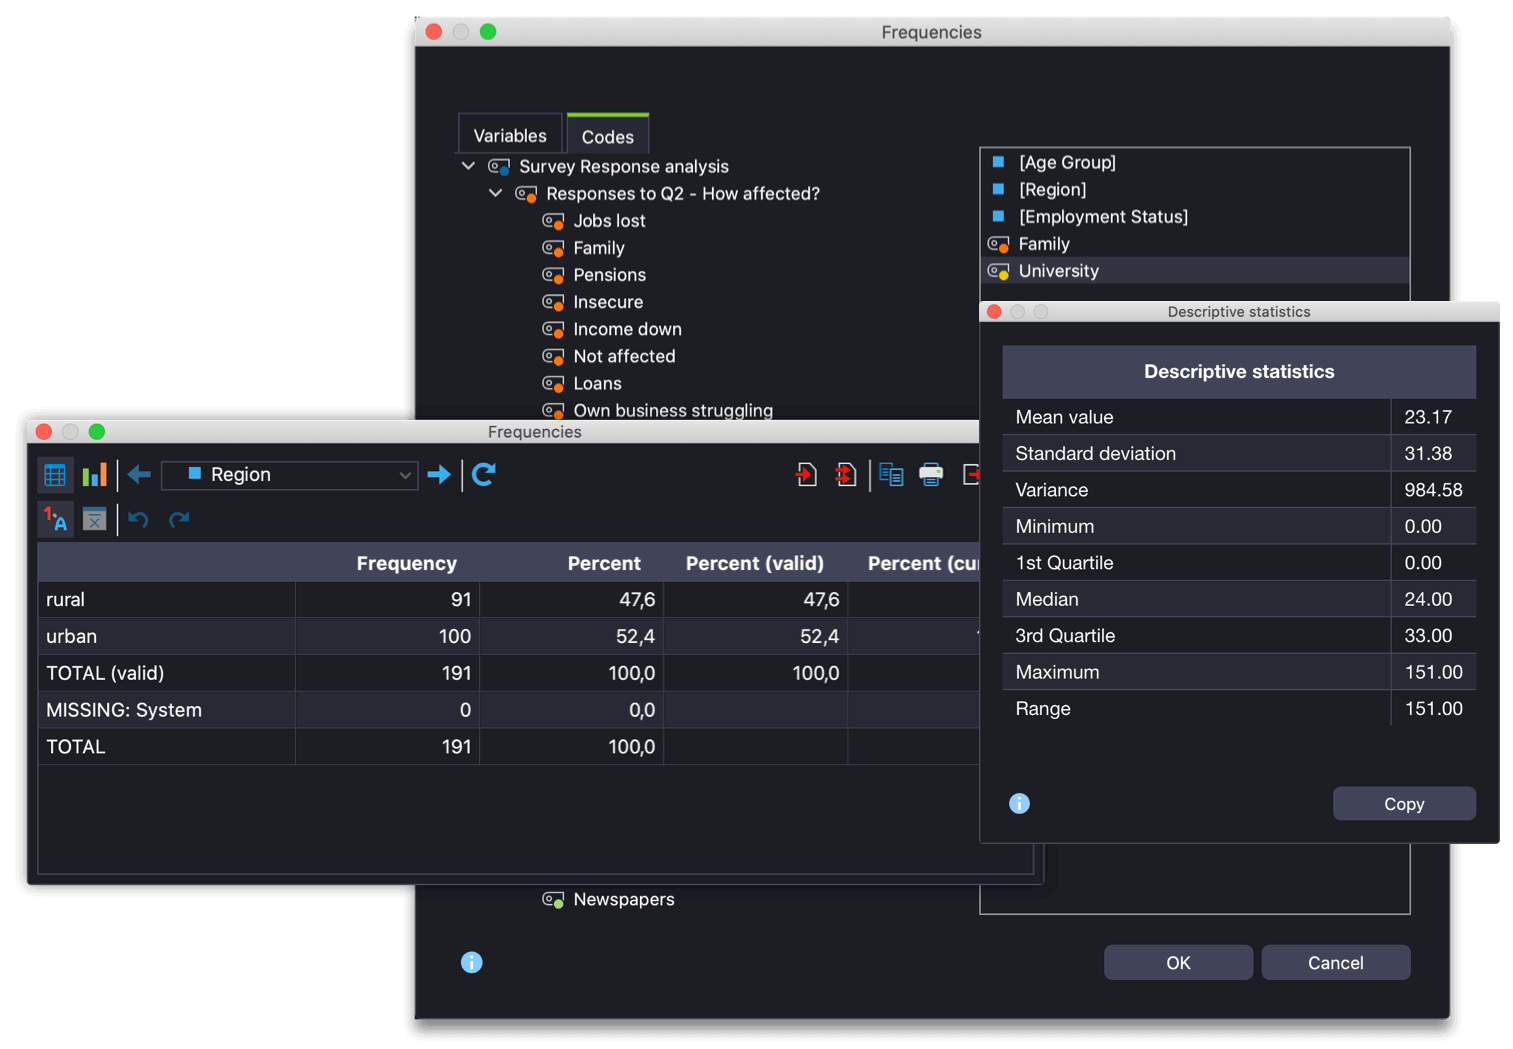
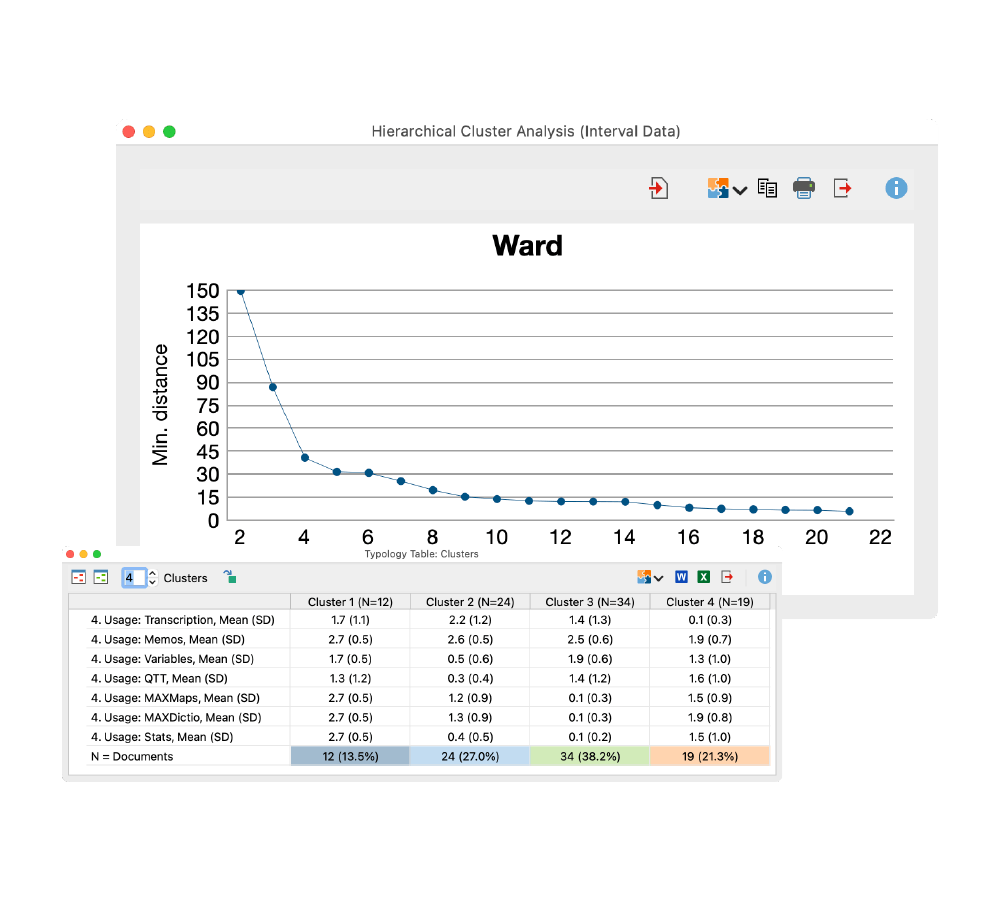
Descriptive Statistics
Create simple charts to compare frequencies and percentages for variables or codes. Frequency charts are interactive – remove and merge columns or rows with automatic recalculation of percentages. Create customizable charts and graphs for your results and copy them into the output viewer or directly into your reports and presentations. Calculate descriptive statistics including mean, standard deviation, variance, quartiles, median, and range.
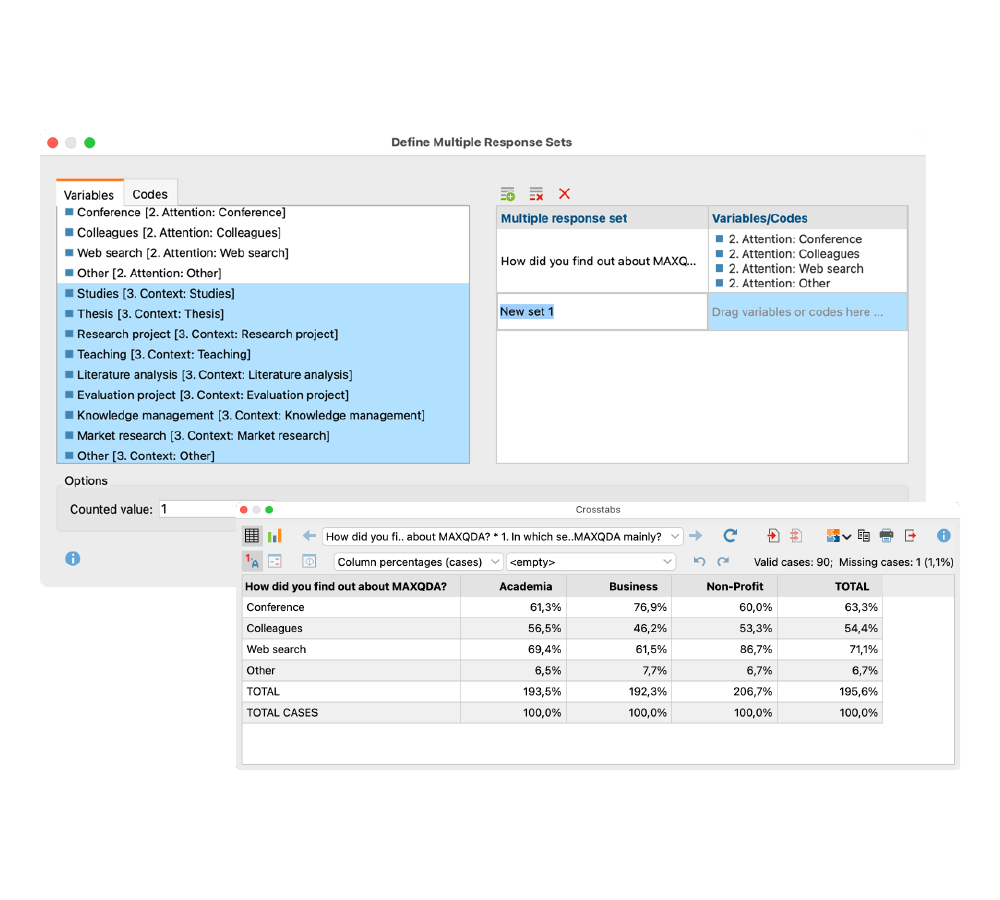
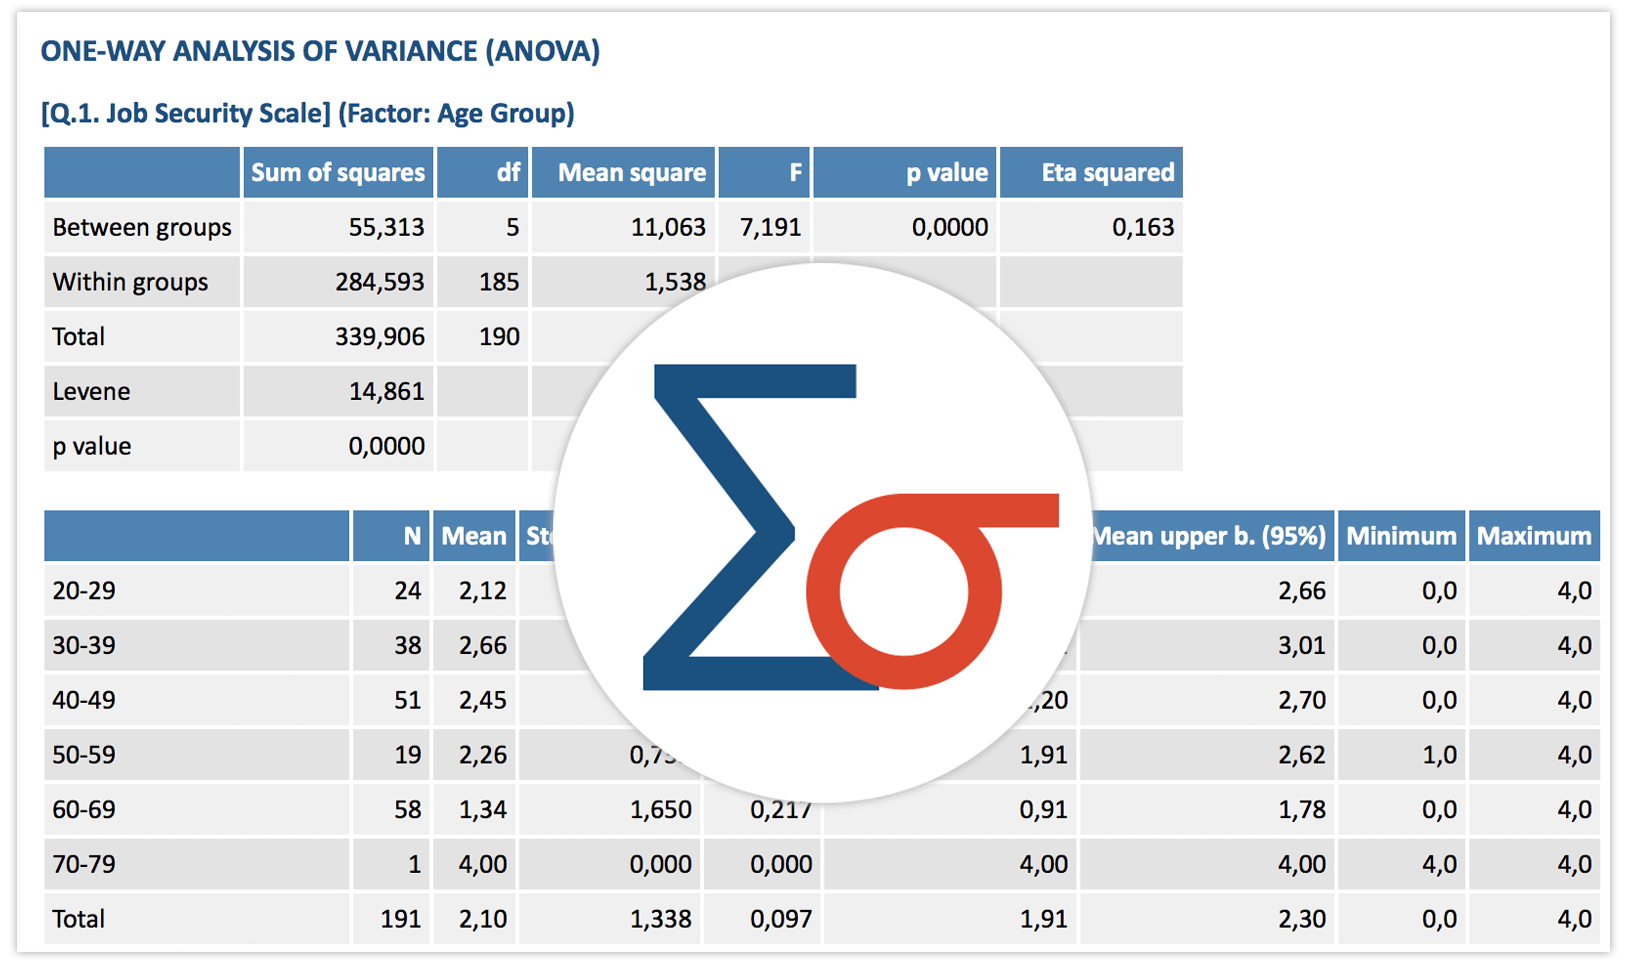
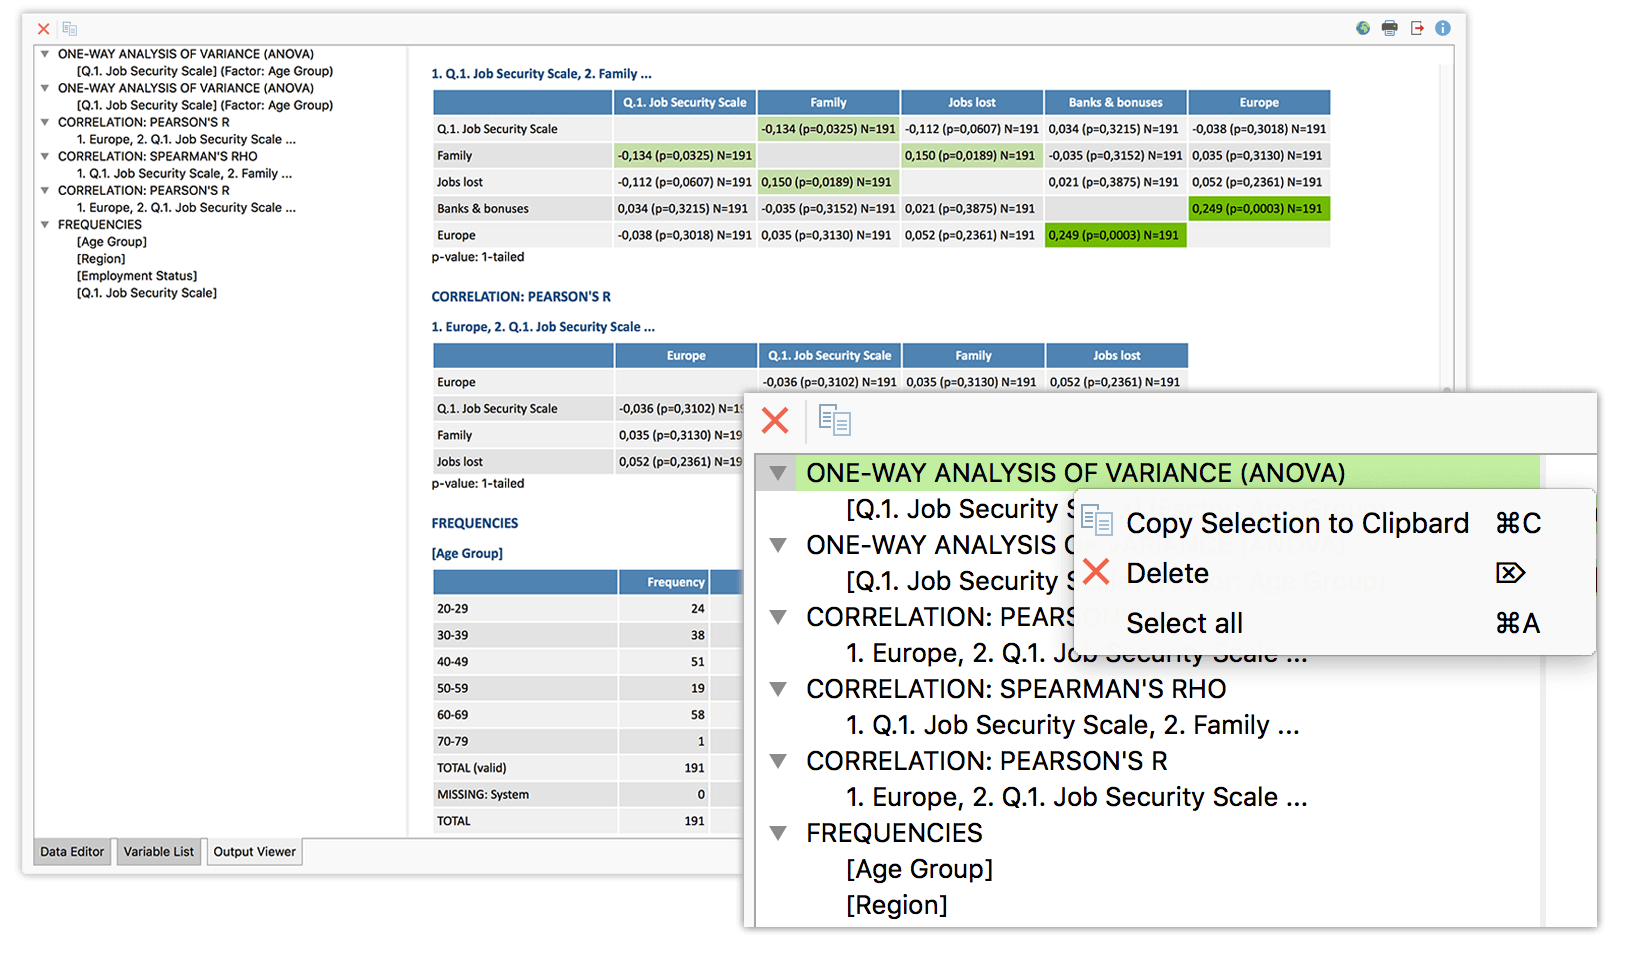
Compare Groups
There are a variety of methods for examining relationships between two or more variables in MAXQDA Analytics Pro. Crosstabs are among the basics that no statistics program should be without: They are easy to customize and can provide valuable insights to anyone – not just statisticians. Highlighting options make interpreting the results quick and easy. If you’re looking for something more sophisticated, you can also compare the effect of a factor on different groups with an analysis of variance (ANOVA).
Discover correlations
One of the most basic statistical procedures to explore relationships within your data is to test for correlations. With the Stats module, you can calculate the two most common correlation coefficients with just a few mouse clicks: Pearson’s r and Spearman’s Rho.
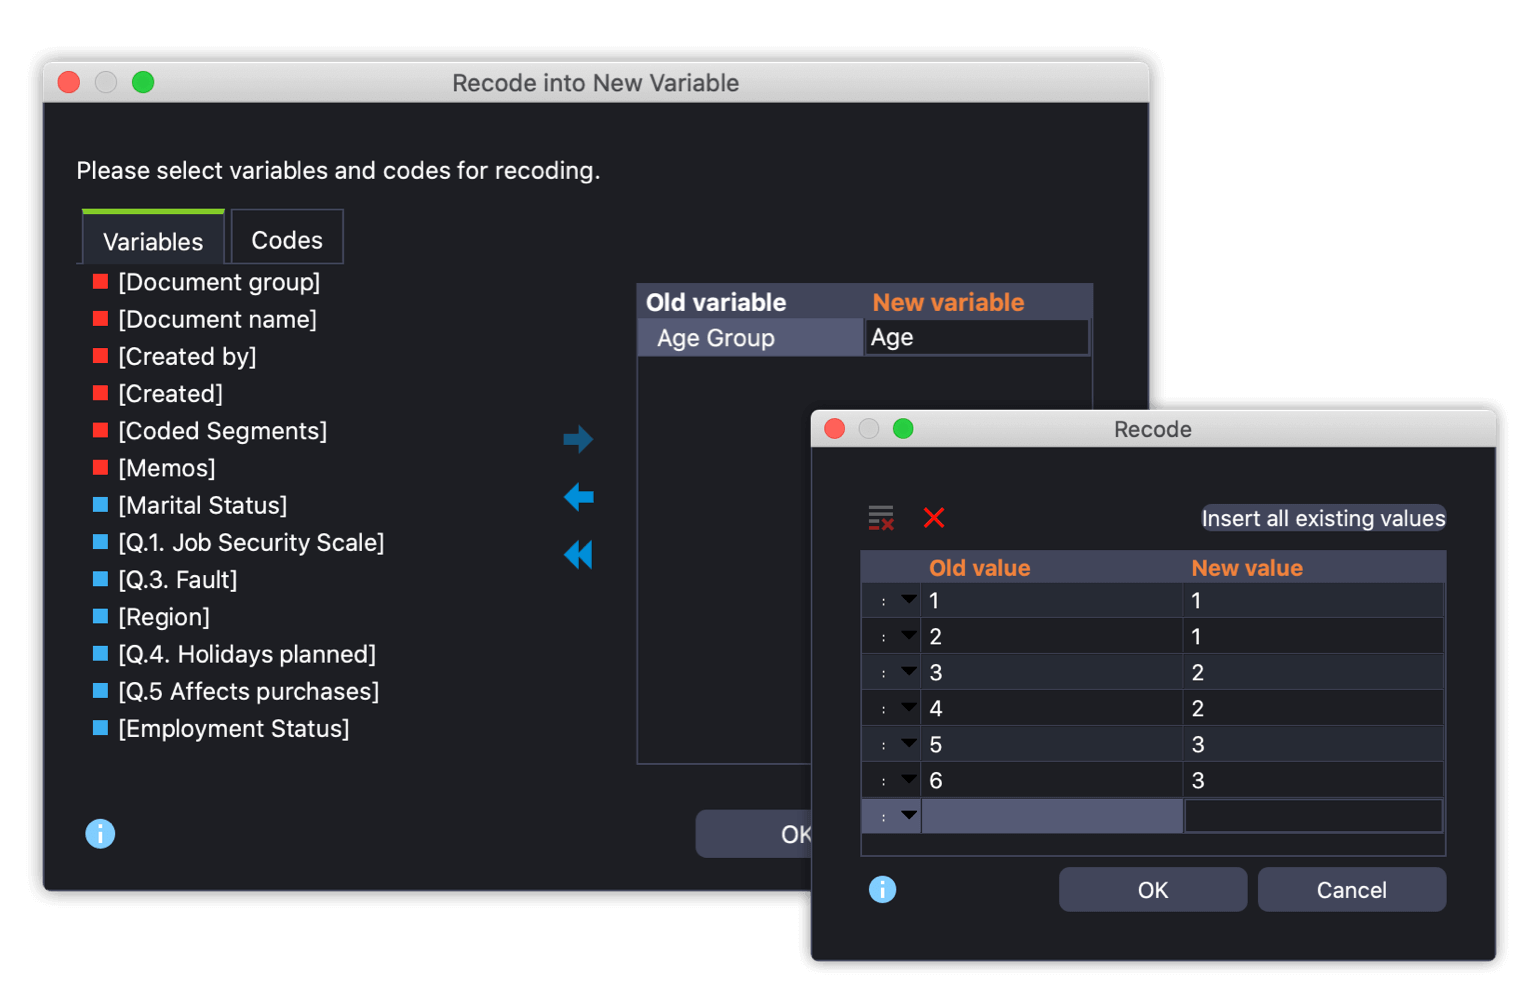
Scale, Compute & Recode
Creating your own scale can be a good way to properly measure the dimensions you are most interested in. Calculate Cronbach’s alpha to check reliability in MAXQDA Analytics Pro. Save scales as new variables and calculate the sum or mean of the item values. Create new variables bycalculating or recoding existing variable values.
User Friendly Output Viewer
With MAXQDA Analytics Pro we extend our high standard of usability into the realm of statistical analysis. The integrated output viewer is just one of the many features we’ve implemented to deliver on this promise, but a key one: every table and chart is exported to the output viewer with just one click. There they stay, no matter what you do in the meantime -waiting to be transferred into your report with a simple copy & paste.
Lisainfo
| Litsentsitüüp | Business annual, Business 3-year, Business 5-year, Academia annual, Academia 3-year, Academia 5-year, Non-profit annual, Non-profit 3-year, Non-profit 5-year |
|---|